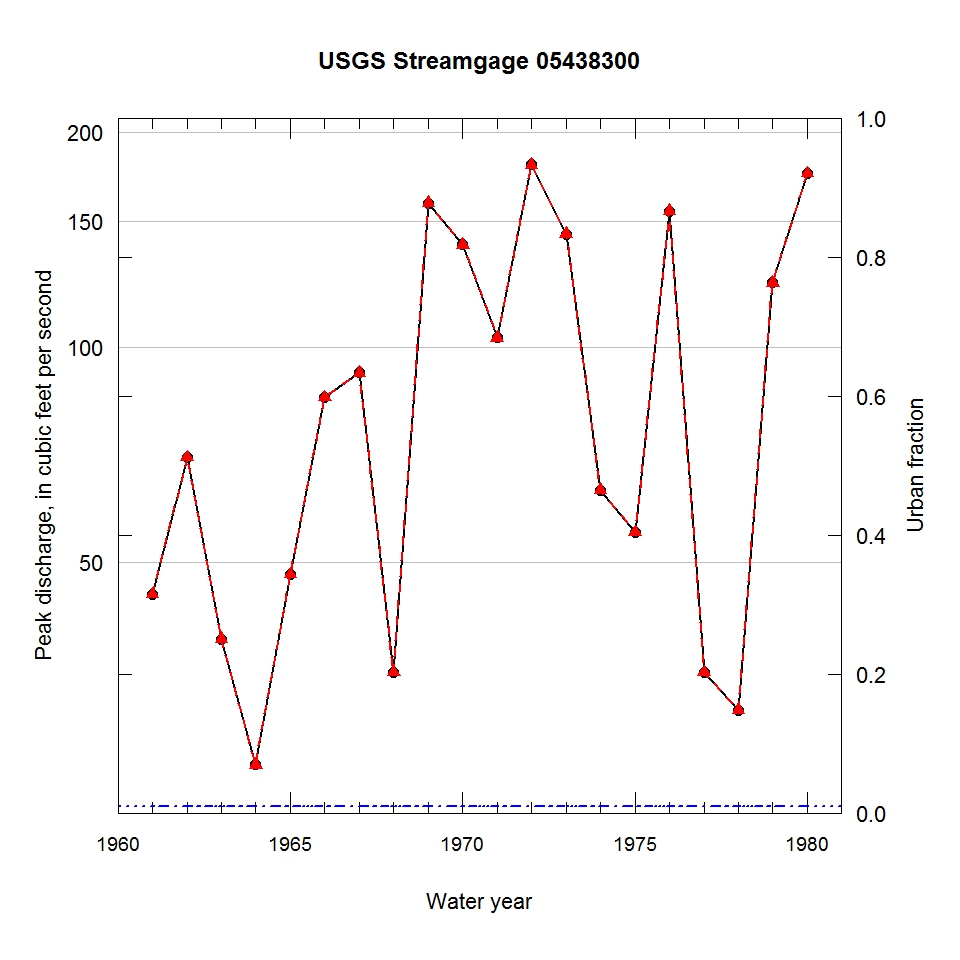
Observed and urbanization-adjusted annual maximum peak discharge and associated urban fraction and precipitation values at USGS streamgage:
05438300 LAWRENCE CREEK TRIBUTARY NEAR HARVARD, IL


| Water year | Segment | Discharge code | Cumulative reservoir storage (acre-feet) | Urban fraction | Precipitation (inches) | Observed peak discharge (ft3/s) | Adjusted peak discharge (ft3/s) | Exceedance probability |
| 1961 | 1 | -- | 0 | 0.010 | 0.758 | 45 | 45 | 0.831 |
| 1962 | 1 | -- | 0 | 0.010 | 1.283 | 70 | 70 | 0.634 |
| 1963 | 1 | -- | 0 | 0.010 | 1.343 | 39 | 39 | 0.872 |
| 1964 | 1 | 4B | 0 | 0.010 | 0.032 | 26 | 26 | 0.938 |
| 1965 | 1 | -- | 0 | 0.010 | 0.787 | 48 | 48 | 0.809 |
| 1966 | 1 | -- | 0 | 0.010 | 1.463 | 85 | 85 | 0.500 |
| 1967 | 1 | -- | 0 | 0.010 | 1.410 | 92 | 92 | 0.444 |
| 1968 | 1 | -- | 0 | 0.010 | 0.744 | 35 | 35 | 0.895 |
| 1969 | 1 | -- | 0 | 0.010 | 0.779 | 159 | 159 | 0.136 |
| 1970 | 1 | -- | 0 | 0.010 | 0.971 | 139 | 139 | 0.191 |
| 1971 | 1 | -- | 0 | 0.010 | 0.467 | 103 | 103 | 0.369 |
| 1972 | 1 | -- | 0 | 0.010 | 0.560 | 180 | 180 | 0.091 |
| 1973 | 1 | -- | 0 | 0.010 | 0.622 | 144 | 144 | 0.176 |
| 1974 | 1 | -- | 0 | 0.010 | 1.066 | 63 | 63 | 0.692 |
| 1975 | 1 | -- | 0 | 0.010 | 0.032 | 55 | 55 | 0.758 |
| 1976 | 1 | -- | 0 | 0.010 | 1.035 | 155 | 155 | 0.146 |
| 1977 | 1 | -- | 0 | 0.010 | 0.727 | 35 | 35 | 0.895 |
| 1978 | 1 | -- | 0 | 0.010 | 1.450 | 31 | 31 | 0.917 |
| 1979 | 1 | -- | 0 | 0.010 | 1.574 | 123 | 123 | 0.260 |
| 1980 | 1 | -- | 0 | 0.010 | 0.545 | 175 | 175 | 0.098 |

